Shortly after the election, Woroni surveyed ANU students, both on and off-campus to determine a rough picture of how the ANU voted in the 2022 Federal Election.
We all have our theories about each of the colleges. Is Burgmann College ruled by a cabal of Liberal Party elites? Is Burton and Garran Hall (B&G) truly a greenie paradise? Does Toad Hall even exist? Thankfully, we finally have the answers to your burning questions.
With over 400 individual responses, we made several interesting findings. The stereotype of B&G ressies as Greens voters is probably true, as it is of all other ANU colleges. Climate change dwarfed all other election issues for ANU students in the election.
The median voter at ANU is a Greens voter who regards climate change as the most important issue in every college apart from Burgmann. Burgmann has a much larger proportion of Labor voters than other Colleges. Finally, the ascendency of independents in the ACT such as David Pocock was evident in the data, as those who lived off campus tended to favour minor parties in the Senate.
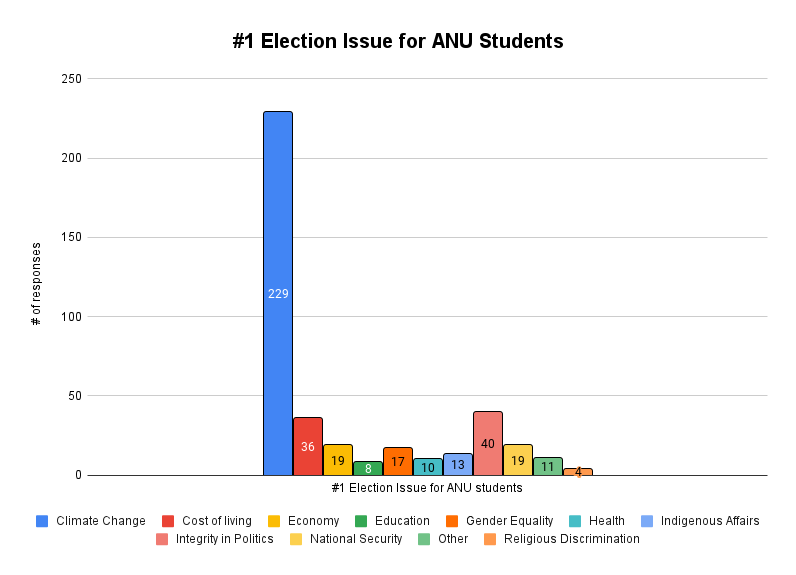
As you probably noticed in the previous graph, climate change was by far the most important issue to ANU students across all colleges. In fact, climate change received almost six times as many responses as the next answer (cost of living).
The election issue with the fewest responses from ANU students was religious discrimination. This is despite the significant election coverage on this topic following the Morrison Government’s decision to not introduce its watered down Religious Discrimination Bill before the Senate.
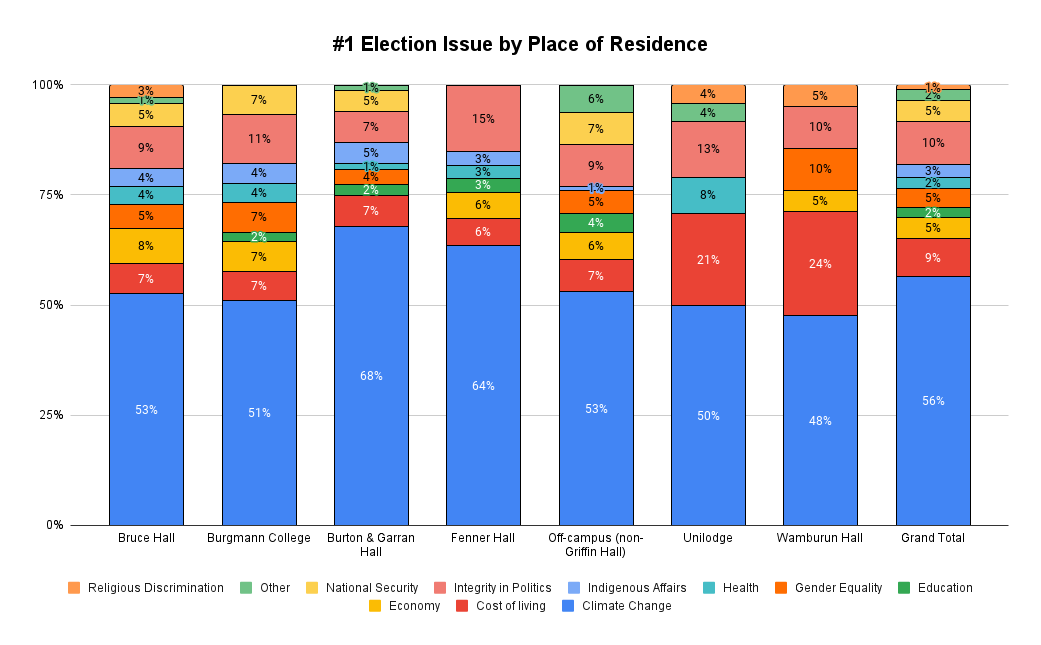
The median voter at the ANU (represented by the 50 percent line) in every college, except Wamburun Hall, regarded climate change as their number one issue in the election. Climate change was notably a much more prominent issue for students living at B&G, with 68 percent of its residents regarding it as the most significant issue.
This is in contrast to the average ANU student (represented by the grand total column), where 56 percent of respondents regarded it as their number one election issue. Cost of living featured far more prominently for respondents from UniLodge and Wamburun, though we also received far fewer responses from these colleges.
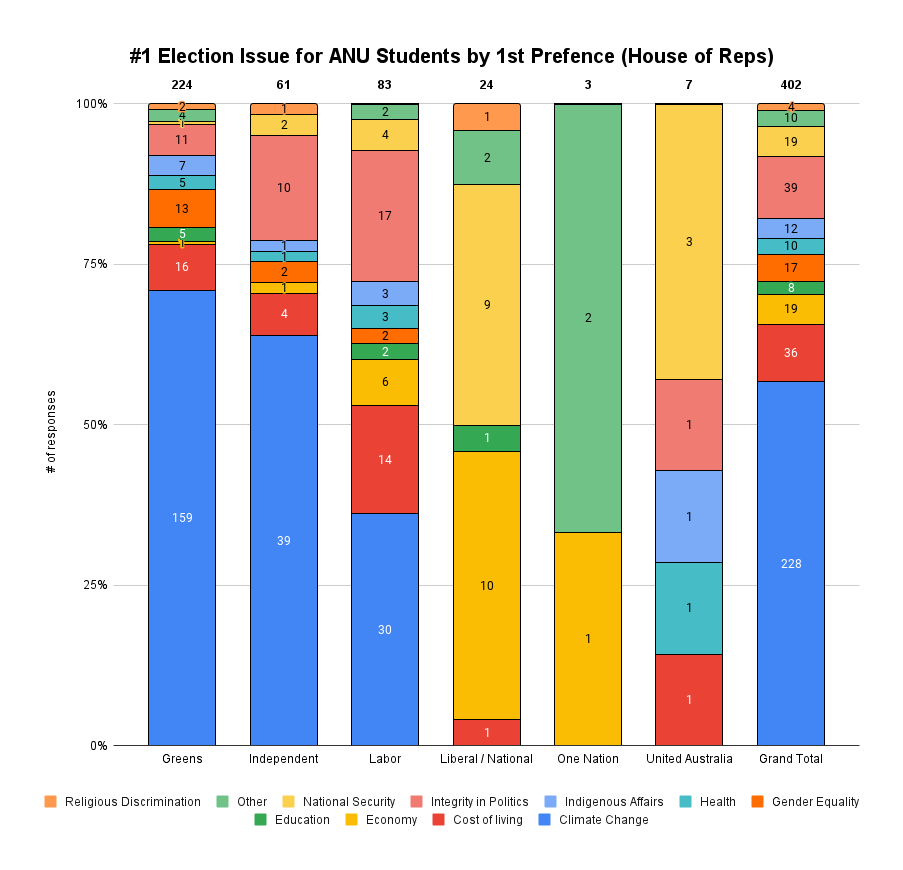
Breaking down election issues by party yields much less-uniform results than when comparing election issues by college. While we’ve included the raw numbers in the above graph, you can place your cursor over the graph to get an idea of the exact proportion of each issue by party.
Not one person who voted for the Liberal/National Coalition (LNP) in the election viewed climate change as their number one election issue. Integrity in politics was also notably absent.
The same was true for those who voted for One Nation and the United Australia Party. This is despite the Former Morrison Government Energy Minister Angus Taylor continuously claiming his party was “meeting and beating its emissions targets.” Issues of the economy and national security were far more prominent for those who voted for the LNP.
The opposite is true for those who voted for the Greens. Predictably, climate change was by far the number one issue for Greens voters at the ANU. For these respondents, the least prominent issues were national security and the economy. This was followed by the cost of living, which made up seven percent of the responses from Greens voters.
The only stand-out issue for Labor voters was the higher proportion of respondents (20.5 percent) who viewed integrity in politics as their top issue.
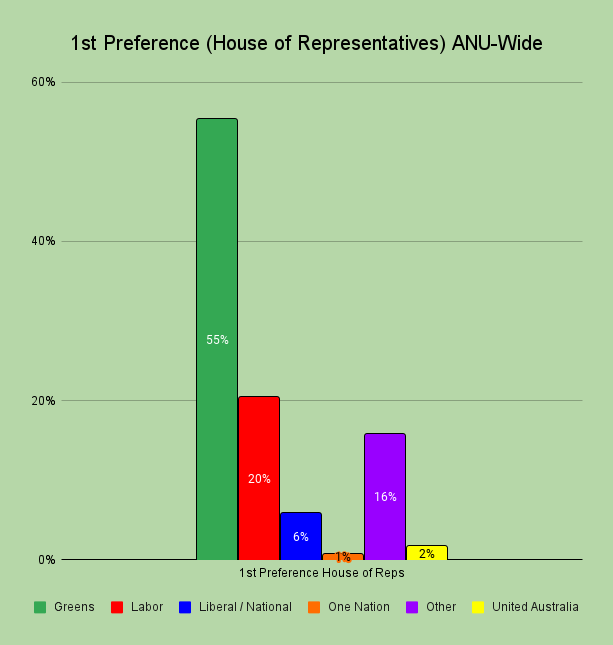
A surprising finding is the high proportion of ANU students who voted for the Greens in the House of Representatives. While the Greens made up roughly 12 percent of the vote nationally, and 19 percent in the ACT, at the ANU they attracted 55 percent of the votes from our respondents.
Conversely, while Labor and the Coalition made up around 33% and 36% nationally respectively, Labor only made up 20 percent over voters at the ANU while the Coalition convinced a minuscule 6 percent of ANU voters.
Perhaps the ANU student body truly IS out of touch with ordinary Australians. Alternatively, maybe this is because Greens tend to attract a much higher proportion of younger voters (which tend to populate the ANU) than the other major parties, while parties such as Labor and the Coalition have been notably struggling in this regard.
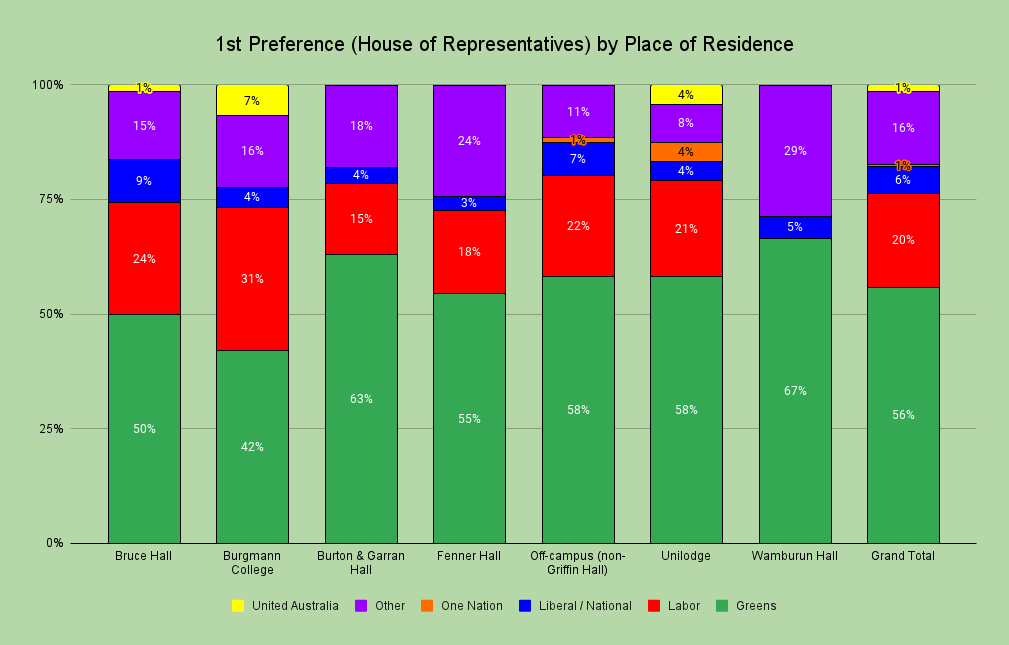
Amongst the colleges, Burgmann had the highest proportion of Labor voters and the lowest proportion of Greens voters. Hopefully this means we can finally put that stereotype about the college being run by a bunch of young libs to bed. It is interesting to note that Burgmann did have the highest proportion of students who voted for the United Australia Party, though they only made up 7 percent.
Another rather interesting finding is that apparently Wamburun residents skew towards the Greens and independents, largely ignoring Labor, perhaps due to the relatively low sample-size from Wamburun.
The same could be said with regard to UniLodge and One Nation – with four 4 percent of just 24 respondents voting for One Nation
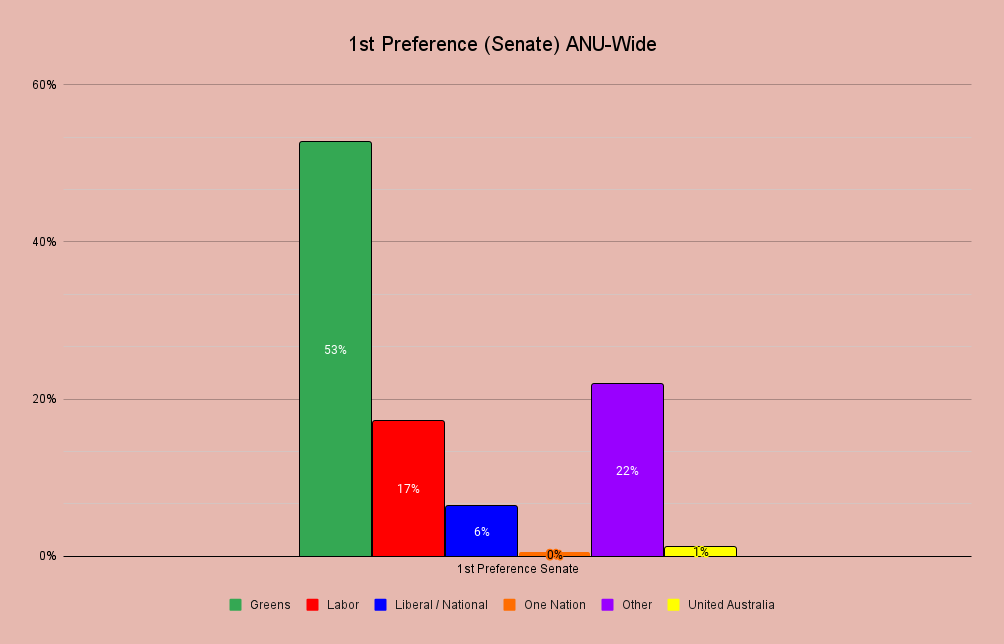
In the Senate, Independents featured far more prominently among our respondents’ first preferences during the election. This makes sense given minor parties generally perform better in the Upper House.
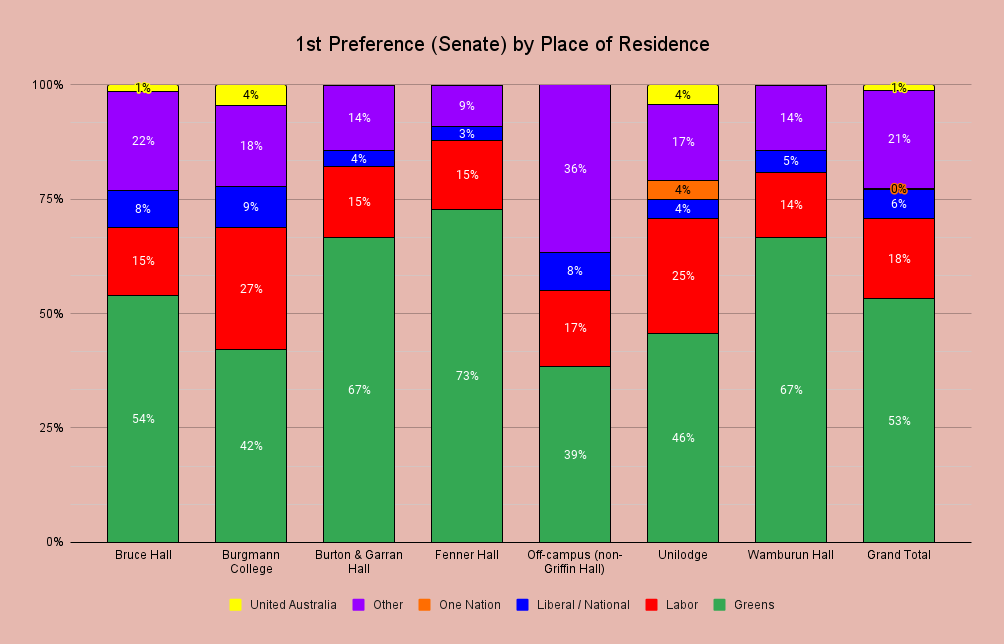
Looking at this by residence, we can see that those who live off-campus were far more likely to have voted for a party outside of the major parties (excluding One Nation and United Australia).
This off-campus trend could probably be attributed to the overwhelming amount of support attracted by David Pocock and Kim Rubenstein during the ACT’s Senate race. Ultimately, Pocock unseated veteran Liberal Senator Zed Seselja, becoming the first Senator for the ACT from outside of the major parties.
It’s also interesting to note that Fenner Hall completely bucked the ACT’s trend, with little love shown for independents in the Senate. Instead, at Fenner, the Greens made up a whopping 73 percent of votes, compared to the 10 percent of the ACT’s votes in the Senate.
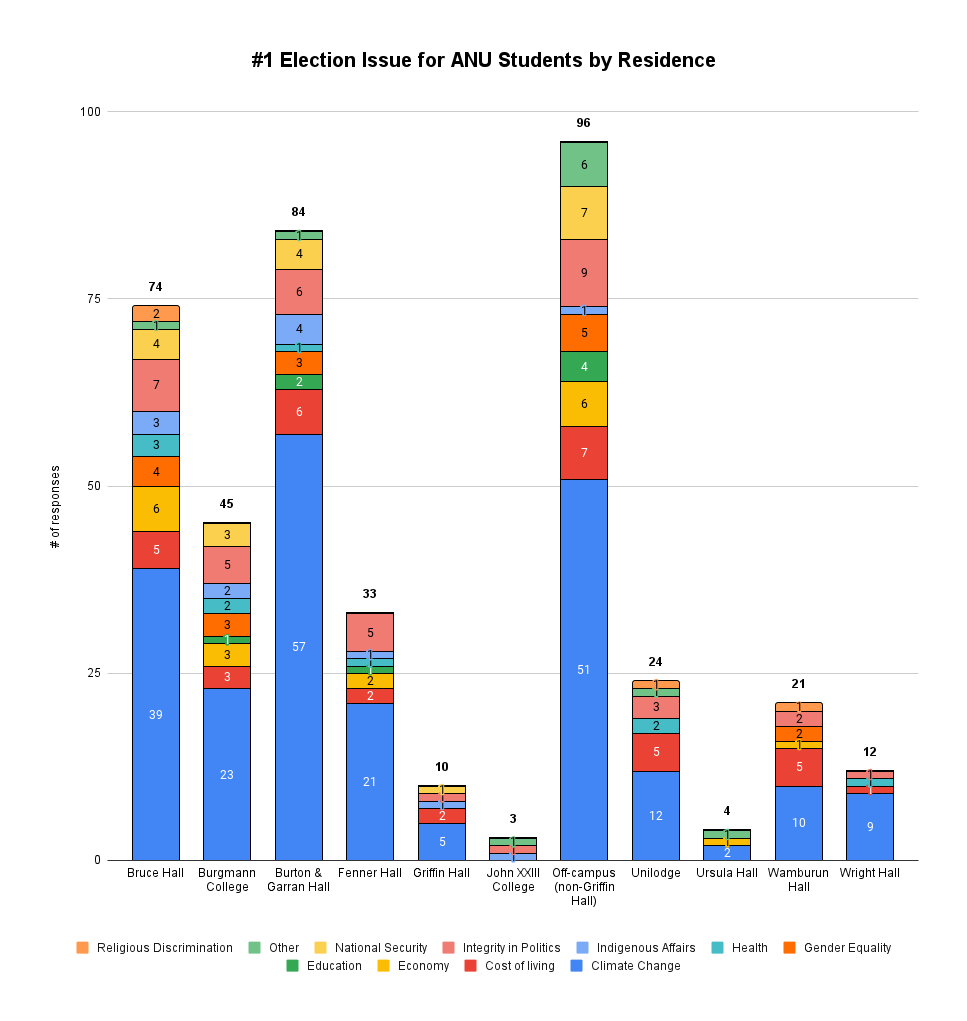
There’s one important omission from this graph – a notable absence of Toad Hall. Perhaps this is the first conclusive evidence we have that Toad Hall does not exist. In all seriousness though, the graph above gives a rough indication of numbers sampled from each of the various colleges. As you can probably tell, we didn’t get anywhere near enough responses from colleges such as Johns and Ursies, Wright, and Griffin. Hence, our omission of these colleges from our analysis.
Obviously, this poll is bound to be riddled with enormous amounts of bias given how difficult it was logistically to get enough responses from each of the halls. So take absolutely everything with a grain of salt.
We acknowledge the Ngunnawal and Ngambri people, who are the Traditional Custodians of the land on which Woroni, Woroni Radio and Woroni TV are created, edited, published, printed and distributed. We pay our respects to Elders past and present. We acknowledge that the name Woroni was taken from the Wadi Wadi Nation without permission, and we are striving to do better for future reconciliation.